
Let’s SEE what trade looks like with the world’s second largest economy.
The Commerce Department served up fresh trade data this week after a disappointing jobs report last Friday. This trade data deserves a closer as the Obama administration starts to sell the newest trade agreement, the Trans-Pacific Partnership.
So let’s take this point by point.
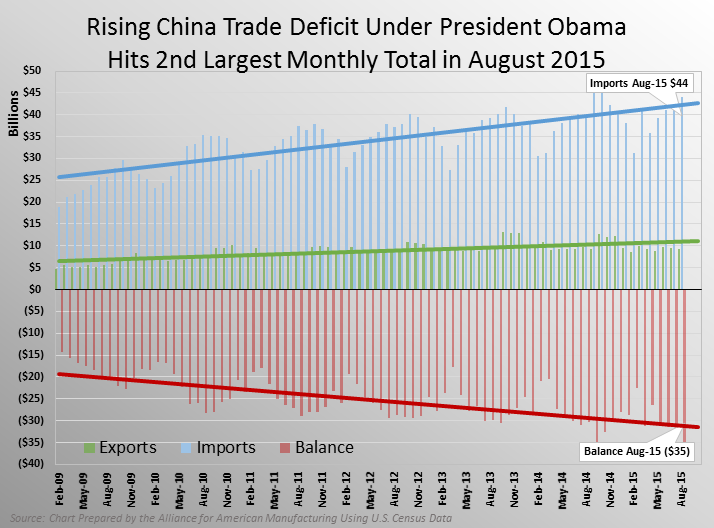
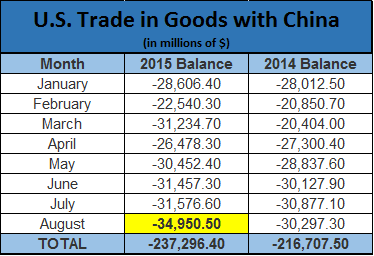
1. The August trade deficit in goods with China—$35 billion—is the second largest monthly total ever.
Only September 2014 was higher, at $35.6 billion.
2. Through eight months, we are $20.6 billion ahead of the same time frame in 2014.
3. The 2015 total is conservatively projected to be $356 billion, based on a monthly average.
That’s $13 billion more than the 2014 total. And, the 2015 total will likely exceed this projection as September-December totals often exceed the monthly average.
This widening deficit impacts manufacturing jobs, as AAM President Scott Paul said:
"Manufacturing lost 9,000 jobs in September, 19,000 jobs in August, and has been losing ground all summer. There is no denying that an overly strong dollar, weakness overseas, foreign currency devaluations, a paucity of public investment in the US, and China’s overproduction are all taking their toll on American industry.”
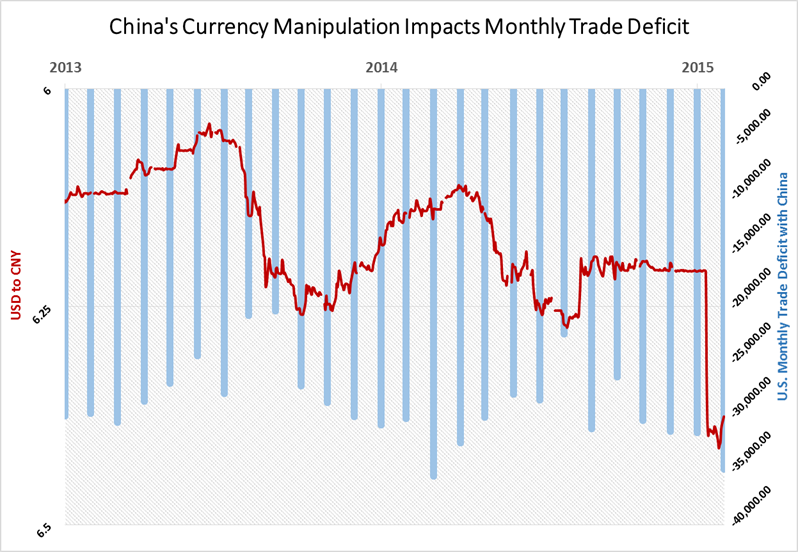
4. If you look at the period of August 2014 through August 2015, one could argue that there is a lagging indication that the exchange rate impacts the monthly trade deficit.
Source: Prepared by the Alliance for American Manufacturing using U.S. Census Data. Scott Boos contributed to this post.